Configure Keycloak notifications and alerts
What you’ll accomplish
Section titled “What you’ll accomplish”You’ll enable Prometheus alerting rules for Keycloak so that changes to realm configurations, user accounts, and system administrator memberships fire alerts through Alertmanager. UDS Core already collects Keycloak event logs and converts them into Prometheus metrics by default. This guide enables the alerting rules that act on those metrics.
Prerequisites
Section titled “Prerequisites”- UDS CLI installed
- UDS Registry account created and authenticated locally with a read token
- Access to a Kubernetes cluster with UDS Core deployed
Before you begin
Section titled “Before you begin”UDS Core ships three layers of Keycloak observability, each controlled by a detailedObservability Helm value:
| Helm value | Default | Description |
|---|---|---|
detailedObservability.logging.enabled | true | Sets Keycloak’s JBossLoggingEventListenerProvider to info level with sanitized, full-representation output |
detailedObservability.dashboards.enabled | true | Loki recording rules that convert event logs into Prometheus metrics, plus the UDS Keycloak Notifications Grafana dashboard |
detailedObservability.alerts.enabled | false | PrometheusRule alerts that fire when the recording-rule metrics detect changes |
Because logging and dashboards are enabled by default, you can already view Keycloak event metrics in Grafana without any configuration. This guide enables the third layer (alerting rules) so that changes trigger notifications through Alertmanager.
-
Enable Keycloak alerting rules
Add the following override to your UDS Bundle configuration:
uds-bundle.yaml packages:- name: corerepository: registry.defenseunicorns.com/public/coreref: x.x.x-upstreamoverrides:keycloak:keycloak:values:# Enable Prometheus alerting rules for Keycloak event modifications- path: detailedObservability.alerts.enabledvalue: trueThe override creates a
PrometheusRulewith three alerts based on the recording-rule metrics that are already active by default:Alert Description KeycloakRealmModificationsDetectedwarning: Fires on realm configuration changes within a 5-minute window KeycloakUserModificationsDetectedwarning: Fires on user or group membership changes within a 5-minute window KeycloakSystemAdminModificationsDetectedcritical: Fires on system administrator membership changes within a 5-minute window Alertmanager receives all three alerts. To route them to Slack, PagerDuty, email, or other channels, see Route alerts to notification channels.
-
Create and deploy your bundle
Build the bundle and deploy it to your cluster:
Terminal window uds create <path-to-bundle-dir>uds deploy uds-bundle-<name>-<arch>-<version>.tar.zst
Verification
Section titled “Verification”Confirm alerting rules are active:
# Verify the PrometheusRule existsuds zarf tools kubectl get prometheusrule -n keycloak
# Verify recording rules ConfigMap exists (should already be present by default)uds zarf tools kubectl get configmap -n keycloak -l loki_rule=1
Verify through the Grafana UI:
- Alerts: Open Grafana Alerting > Alert rules and filter for
Keycloak. The three Keycloak alerts should appear in the list. - Recording rules: Open Grafana Explore, select the Prometheus datasource, and query
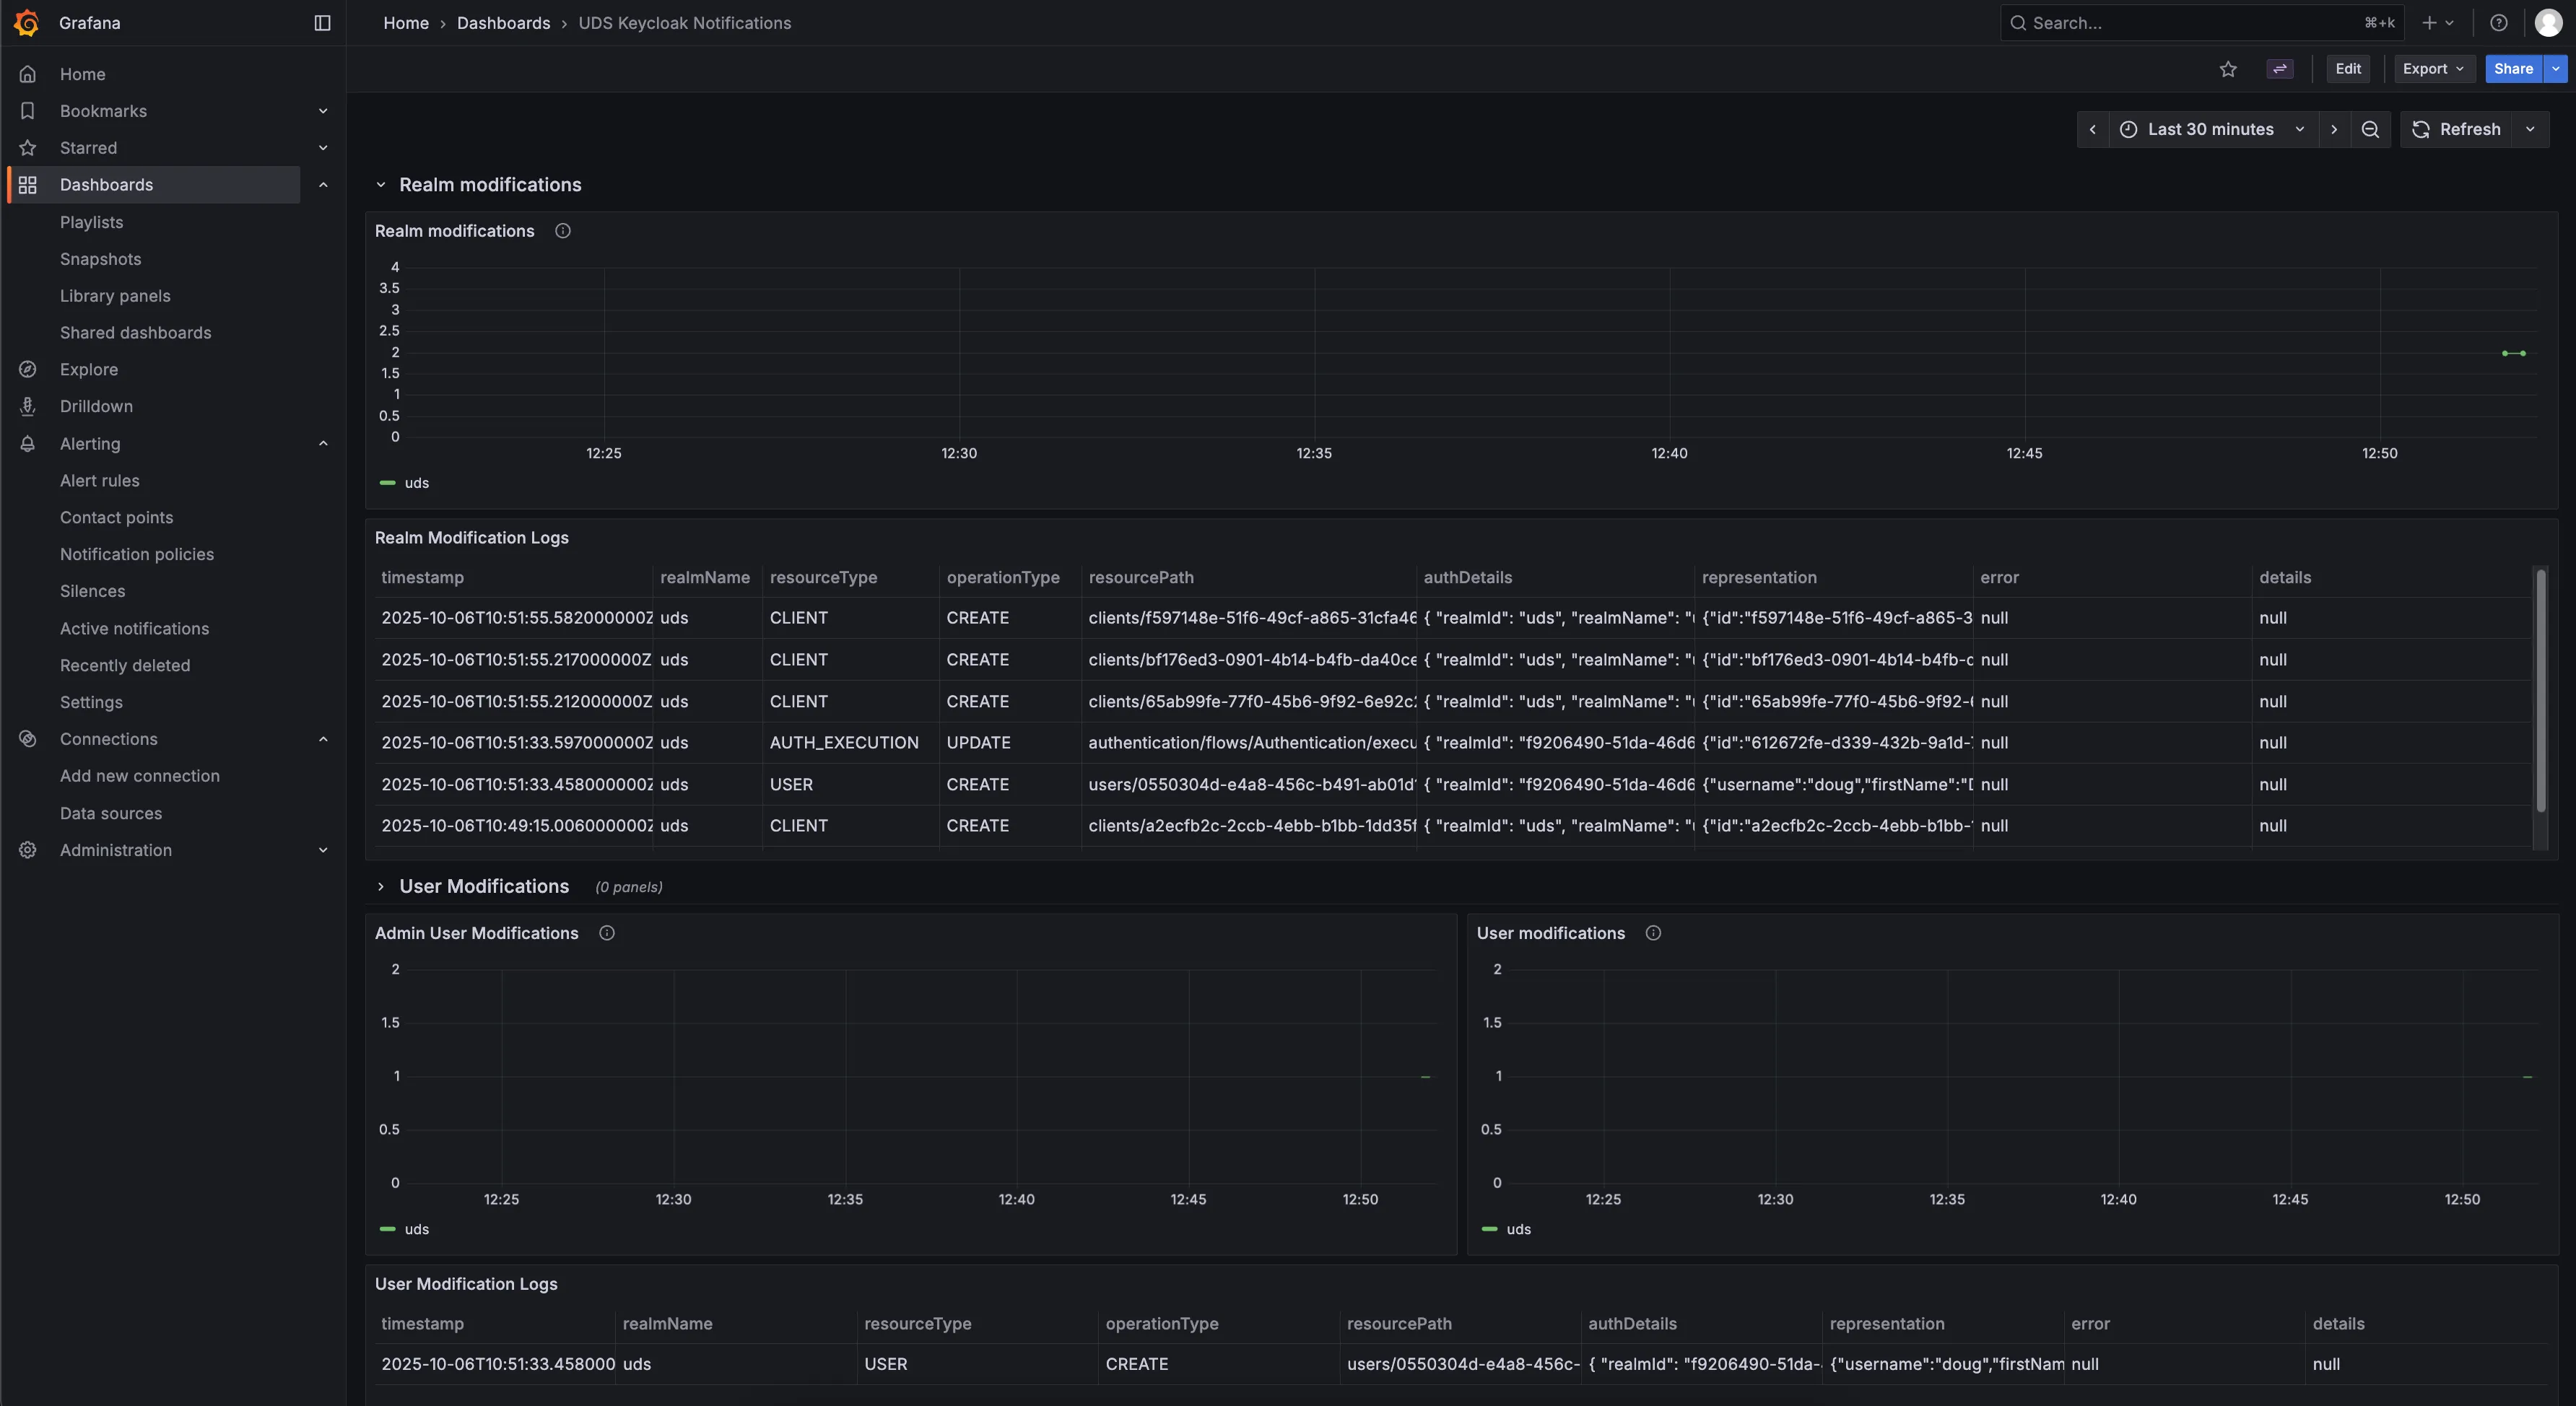
uds_keycloak:realm_modifications_count. If the metric returns data, the recording rules are working. - Dashboard: Navigate to the UDS Keycloak Notifications dashboard in Grafana to view the metrics and associated log tables.
The dashboard displays metric counts and associated Keycloak event log tables for each modification type.
Troubleshooting
Section titled “Troubleshooting”Problem: Alerts not firing after enabling detailedObservability.alerts.enabled
Section titled “Problem: Alerts not firing after enabling detailedObservability.alerts.enabled”Symptom: You set detailedObservability.alerts.enabled to true, but no alerts appear in Grafana Alerting.
Solution: Verify the PrometheusRule exists:
uds zarf tools kubectl get prometheusrule -n keycloakIf the PrometheusRule exists but alerts are not firing, confirm that Keycloak is logging events. Open Grafana Explore, select the Loki datasource, and run one of the following queries depending on which event listener is active in the target realm:
{app="keycloak", namespace="keycloak"} | json | loggerName="uds.keycloak.plugin.eventListeners.JSONLogEventListenerProvider"{app="keycloak", namespace="keycloak"} | json | loggerName=~"org.keycloak.events"If neither query returns results, Keycloak may not have an event listener configured for the target realm. Check Realm Settings > Events > Event Listeners in the Keycloak Admin Console to confirm at least one listener is present.
Related documentation
Section titled “Related documentation”- Route alerts to notification channels - Configure Alertmanager to deliver Keycloak alerts to Slack, PagerDuty, email, and more
- Create log-based alerting and recording rules - Write custom Loki alerting and recording rules
- Create metric alerting rules - Define additional Prometheus-based alerting conditions
- Prometheus: Alertmanager receiver integrations - Full list of supported notification channels
- Identity & Authorization concepts - Background on how Keycloak and SSO work in UDS Core